
The Genetics of the American Nations
(This is also published at The Unz Review)
Throughout my American Nations series (based on the books American Nations: A History of the Eleven Rival Regional Cultures of North America by Colin Woodard and Albion’s Seed: Four British Folkways in America by David Hackett Fischer) I’ve talked about how North America is divided into distinct ethnocultural regions based on historic settlement patterns.

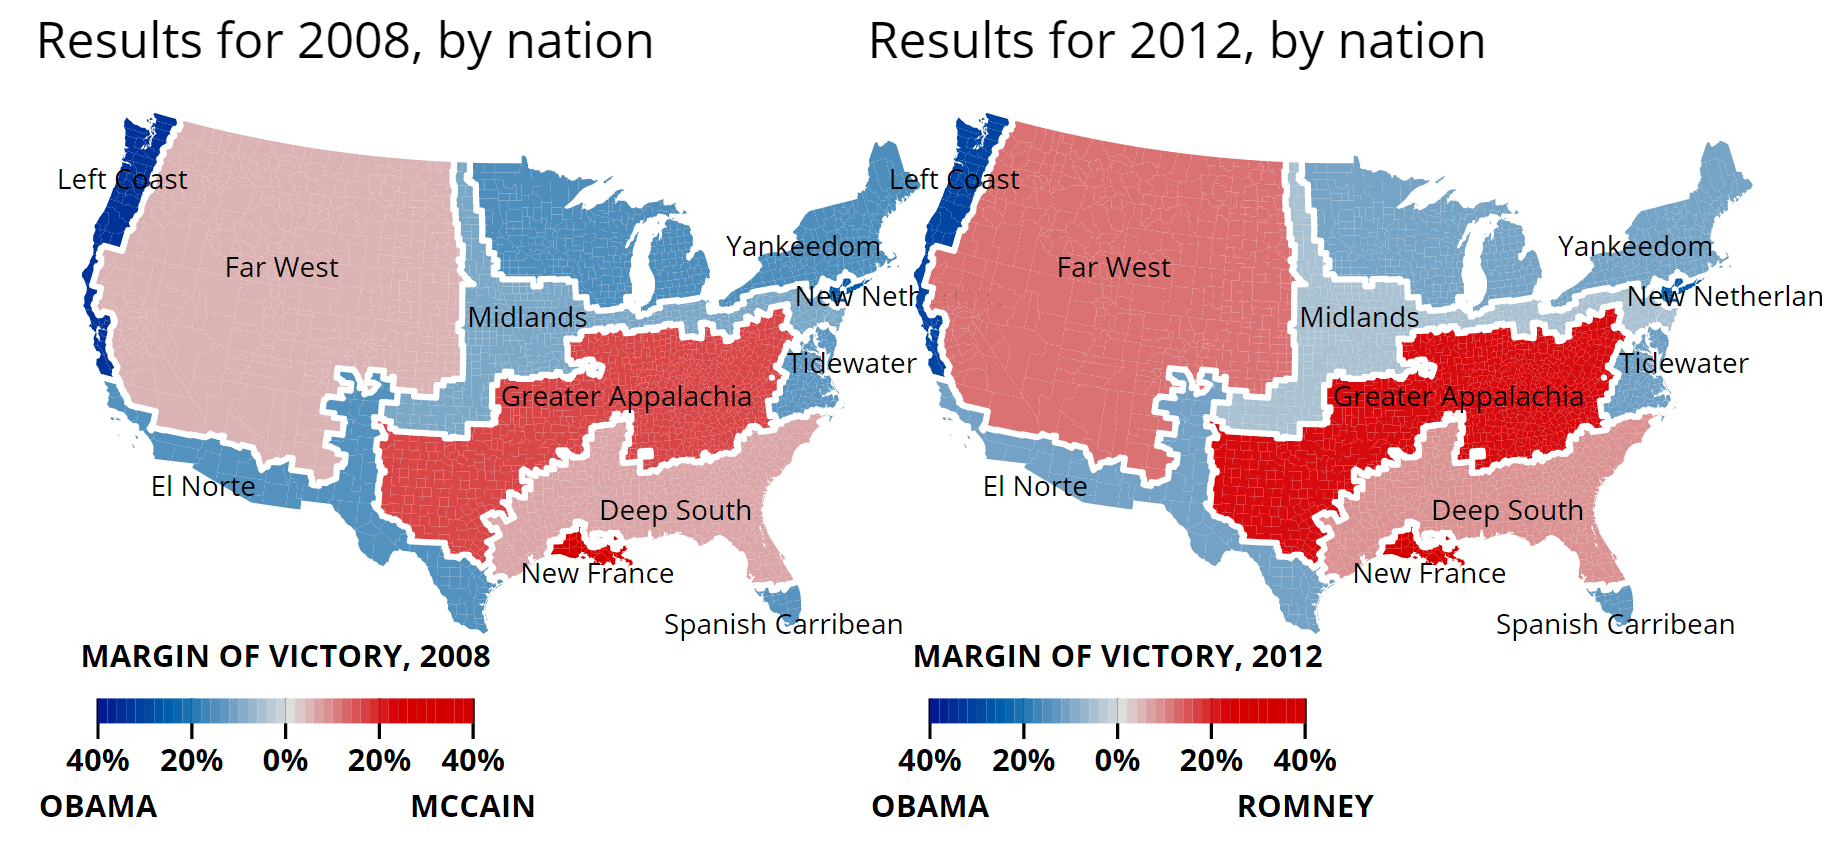
These various regions are visible in many ways, from dialect, politics, enlistment in the military, support for marijuana, average IQ (Maps of the American Nations), attitudes towards the death penalty, abortion, guns, same-sex marriage, and school corporal punishment, as well as overall health, lifespan, and behaviors such as smoking and drug use (More Maps of the American Nations & HBD Is Life and Death):


Support for same-sex marriage


Previously I’ve established that these boundaries reflect genetic differences among different Americans in different places. This is because all human behavioral traits are heritable, with “nurture” (as it’s commonly thought of) playing a minimal to nonexistent role in each. This means that genetic differences between different peoples lead to differences in their behavioral traits, which, collectively, manifests as cultural differences. As John Derbyshire put it, “if dimensions of the individual human personality are heritable, then society is just a vector sum of a lot of individual personalities.” See my Behavioral Genetics Page for more.
It’s also important to note that (as I’ve discussed previously in this series) assimilation is largely an illusion. Cultural and behavioral characteristics can persist for many generations as long as the people who exhibit them remain.
And now, a new paper in Nature bears out the genetic roots of the American nations. In “Clustering of 770,000 genomes reveals post-colonial population structure of North America” (Han et al, 2017), we see that Americans can easily be partitioned into distinct regional clusters:

These clusters map very closely to the boundaries of the American nations, as we can see when they’re superimposed:

Using the vast genomic database of Ancestry.com, the authors were able to partition Americans into distinct clusters. As the authors report:
Here we identify very recent fine-scale population structure in North America from a network of over 500 million genetic (identity-by-descent, IBD) connections among 770,000 genotyped individuals of US origin. We detect densely connected clusters within the network and annotate these clusters using a database of over 20 million genealogical records. Recent population patterns captured by IBD clustering include immigrants such as Scandinavians and French Canadians; groups with continental admixture such as Puerto Ricans; settlers such as the Amish and Appalachians who experienced geographic or cultural isolation; and broad historical trends, including reduced north-south gene flow. Our results yield a detailed historical portrait of North America after European settlement and support substantial genetic heterogeneity in the United States beyond that uncovered by previous studies.
They describe their methods:
To investigate recent, fine-scale population structure in the United States, we leveraged one of the largest human genetic data sets assembled to date: genome-wide genotypes of 774, 516 individuals born (96%) or currently residing (4%) in the United States (Supplementary Table 1; Supplementary Fig. 1). All individuals were genotyped at 709, 358 autosomal single-nucleotide polymorphisms (SNPs) using the Illumina Human OmniExpress platform as part of the AncestryDNA direct-to-consumer genetic test, and have consented to participate in research (Methods). In this sample, we analysed patterns of identity-by-descent (IBD)16, which have been shown to reveal signatures of recent demographic history3,17,18,19,20,21. If two individuals share an ancestor from the recent past, they will likely carry one or more long chromosomal segments inherited IBD from that ancestor.
In short, their giant sample and rich genealogical data allowed them to detect large patterns of shared ancestry in living Americans. And, as expected the American nations clearly emerge from the genetic data.
How did this pattern emerge? In short, this is ultimately the result of the four British folkways of Albion’s Seed. Here the genetic data show that they remain alive and well. Previously, in my post Genes, Climate, and Even More Maps of the American Nations, we saw that the founding British colonists came from distinct parts of the British Isles and settled in different parts of North America. The founding British stock are themselves visible in the genetic data, as we saw from fine-scale analysis of Britain (Leslie et al 2015, ungated link here):


As I put it in Genes, Climate, and Even More Maps of the American Nations:
Genetic differences between groups of people, once established, persist as long as the different groups do until diluted or erased by admixture (this is known as the Founder effect). As well, new differences can emerge within a single population as selective migration leads this initial population to fission into two or more daughter populations (see here and here – more on that to follow).
In short, tiny genetic differences between two groups of people can lead to large differences in behavioral traits. This extents to all facets of human behavior – a point driven home by a recent paper correlating linguistic diversity across Europe with genetic diversity there (Longobardi et al, 2015).
But why do the American nations follow the pattern that they do? It turns out that this pattern was hardly a coincidence.
The founding colonial groups landed at various spots across the North American east coast:
From there, the nations spread westward across the continent. However, they did so in a certain way, as the next map will show:
[…]
Geography dictated the settlement of the country:
An example of this process can be seen in the settlement of the “upper Midwest” (Hudson, 1986):
Settlers moved to places where they could easily transplant their way of life. Areas of similar climate obviously aided in that aim. In the upper Midwest, Yankee and Midland settlers were joined by German and Scandinavian immigrants (as detailed in the preceding posts), who were also coming to areas climatically similar to their old homes.


These settlements have left their genetic as well as cultural mark across the continent.
Now, it’s important to understand what these data actually mean. These clusters do not mean that the descendants of the colonial settlers are numerically dominant in their respective regions, because they are not. Over the course of the continent’s history, the descendants of the original settlers were joined by subsequent immigrants, mostly other Europeans, who themselves settled in different parts of the country. As we saw previously in Demography Is Destiny, American Nations Edition:


(Tables are from Fulford, Petkov, and Schiantarelli, 2015). These other ethnic groups have a huge impact on the character of the modern United States (and Canada), as we saw on display during the recent presidential election (see The Donald Trump Phenomenon: Part 1: The American Nations).
So what then do the clusters of Han et al mean? While the original colonial ancestry of the country has been overrun by subsequent migrants, the founding stock remain as a genetic undercurrent – a common genetic thread – within each American nation. This is especially true in the nations of the American South, where the colonial settlers received less subsequent migration and the original stock remains strong. As Han et al put it:
Taken together with the IBD network clustering results (Table 1), the visualizations of the genealogical data in North America (Fig. 3) highlight broad-scale demographic trends, as well as patterns specific to individual populations
…
The five largest clusters (third set of rows in Table 1), which we describe as assimilated immigrant clusters, account for a large portion (60%) of the IBD network and exhibit a markedly different profile. Lacking distinctive affiliations to non-US populations, they show almost no differentiation in allele frequencies (FST at most 0.001; Supplementary Table 5) and high levels of IBD to non-cluster members (Supplementary Data 2), suggestive of high gene flow between these clusters. Moreover, few members of these clusters could be assigned to a stable subset, indicating that this clustering is largely driven by continuous variation in IBD. Genealogical data reveal a north-to-south trend (Fig. 5), most consistently east of the Mississippi River (Fig. 3). These findings imply greater east-west than north-south gene flow, which is broadly consistent with recent westward expansion of European settlers in the United States, and possibly somewhat limited north-south migration due to cultural differences.
The descendants of the Puritans, for example, while hardly the dominant genetic group across Yankeedom, nonetheless cluster together because people across Greater New England share that ancestry. This is true for the other nations as well.
Curiously, Han et al seem to have found two distinct currents of Appalachian settlement. I’m unclear about what this represents.
Some more interesting bits of information appear when you dig into Han et al’s supplementary info:

For Yankeedom, we see that the inferred genetic origin area is encompasses East Anglia and Kent, the home of the Puritan settlers. We also see the Scandinavian signal that is the home of many Mormon converts.
This group is also evident along the Left Coast, reflecting the Yankees’ historical settlement there.

For the Midlands, we see that the inferred source area is around Yorkshire in England. Also, the strong German signal corresponds to the Palatine.


For some reason, two Appalachian populations seem to appear. The main difference in Europe appears to be a stronger signal from Germany in the northern population.

For the Tidewater and Deep South, the home of the English Cavaliers (see The Cavaliers) in Southwest England is evidence. The Scottish link (presumably Scots-Irish that settled in the Deep South) is also visible.

These are the “Midwestern immigrants”. As expected, this group is heavily Scandinavian and Eastern European (mostly Polish and Czech/Slovak). However, what’s interesting to me here is that the German settlement here is different from the Germans that settled in the east. These Germans aren’t so heavily from the Palatine, but are from farther north and east. This is interesting in light of my earlier post Germania’s Seed?; different German-Americans in different parts of the country hail from different parts of Germany. Behavioral differences among these different German-Americans are expected.
 The genetic data now serve as the final confirmation of the existence of the American nations (if the mass of other data wasn’t already sufficient). These regional differences have and continue to have huge implications for American society, including the ongoing cultural and political struggle that is now playing out.
Indeed, even in the 2016 presidential election (despite being a bit less regionally skewed than previous years) the American nations still were clearly divided in same ways they were previously:

This is from Woodard’s How Colin Woodard’s ‘American Nations’ explains the 2016 presidential election. There he gives a fine analysis of the regional split in the vote. Rest assured, the divide would be more stark if the White vote alone were examined, especially for the Tidewater, the Deep South, and the Far West.
Trump did manage to pick up considerable support in Yankeedom and the Midlands relative to 2012 and 2008, but the regional split remains.
As it has remained throughout the country’s history. Understanding these divides will be key to understanding our country and its future.
Of course, if you like my work, please do feel free to support it. You can donate via PayPal (accepting Visa and Mastercard) via the button below or to the right:

I am also accepting Bitcoins for those who prefer to use this route. My Bitcoin address is: 1DjjhBGxoRVfdjYo2QgSteMYLuXNVg3DiJ

Also you can pledge a recurring donation per publication through Patreon:
 Thank you very much for your donations!


One Comment
Leave a CommentTrackbacks