
Idiocracy Can Wait?
Post updated, 10/21/14. See below!
It’s general trope in the HBD community: people are getting dumber. The low IQ are outbreeding the high IQ, leading to a slow decline in genetic intellectual potential in the population. Indeed, my own analyses seem to have shown that there was a fair fertility advantage among the lower IQ over the higher IQ (seen most recently in my post Who’s Having the Babies?):
The key limitation is that most of these analyses left off in 1950s cohorts – the people who had their children in the 70s and 80s. This was my parents’ generation! We don’t know what people born later did. Does the apparent dysgenic pattern continue right up to the present day? I decided it was time to take a look:

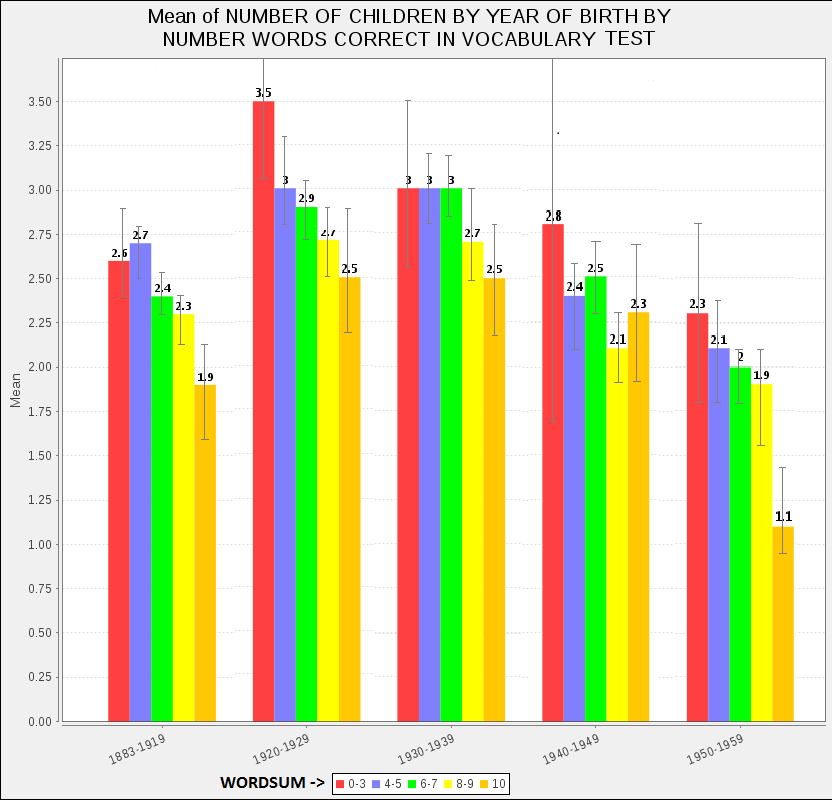
These are average number of children had by White Americans aged 42 and older born during the 1960s, from the GSS (drawn from all GSS years, with those two parameters established), by WORDSUM score, a proxy for IQ. 95% confidence intervals shown, which should give an idea of sample sizes. I’ve collapsed the 0-3 score to make the distribution symmetrical on both sides in terms of number of subjects (there appears to be a significant rightward skew in the WORDSUM data).
Now this is interesting; unlike previous cohorts, fertility among the 1960s cohorts doesn’t look dysgenic for IQ. If anything, it looks slightly eugenic.
Let’s see further what’s going on, by looking at the sexes separately:

Here is fertility by WORDSUM for White males and females separately. Previously, we’ve seen that fertility is eugenic for men and dysgenic for women. For the 1960s cohorts, this appears to be case. But the eugenic fertility for men is strong enough to outweigh the dysgenic fertility for women, so the net effect is slightly eugenic (things were probably a bit more eugenic when you consider childhood mortality is more concentrated on the low end).
To confirm that net White fertility was eugenic, I ran the correlation between WORDSUM and average number of children (for all individuals 42 and older at time of survey):
| Cohorts | Total fertility-IQ correlation | Males only | Females only |
| 1888-1909 | -0.15 | -0.18 | -0.13 |
| 1910-1919 | -0.07 | -0.02 | -0.11 |
| 1920-1929 | -0.08 | -0.08 | -0.08 |
| 1930-1939 | -0.11 | -0.06 | -0.16 |
| 1940-1949 | -0.11 | -0.05 | -0.18 |
| 1950-1959 | -0.07 | -0.02 | -0.12 |
| 1960-1969 | +0.03 | +0.10 | -0.06 |
| 1970-1979 | -0.07 | – | – |
This is a fascinating finding. A big point of alarm in the HBD world (even noted by myself previously) is that people are getting slowly dumber with each generation. Aside from the fact that this process is, at best, very slow (see Greg Cochran here and here), as far as we’re concerned, it doesn’t even appear to continuing! At least for one period, it reversed somewhat. This seriously calls into question the practice of projecting fertility trends into the future on the assumptions current patterns will hold.
So why did dysgenic fertility halt for the 1960s cohort? That’s currently not clear. These were people born in the tail end of the Baby Boom, who would have been having children in the ’80s and ’90s. Economic conditions (which, as we’ve previous seen, can strongly affect fertility – see Another Tale of Two Maps and A Tale of Three Maps) – while clearly being not as good as during the Baby Boom – were not particularly bad, nor particularly good. This was during the “Rust Belt” epoch – “deindustrialization”– where many manufacturing jobs across the Midlands and Greater New England left the region for other parts of the country and overseas. The erosion of earning ability for low-ability males may have stymied their child-bearing prospects compared to earlier decades. I will return to this point shortly.
What about the 1970s cohorts? Well, this is a bit harder to call at the moment, because that generation is still having children (I should know). Here is a look at fertility for 1970s White Americans:
 These are only individuals age 38 and over. I didn’t bother with error bars, because sample sizes are all really small here. I collapsed score 0-4 and 9-10 to make the distribution symmetrical. Sample sizes were too small for me to look at the sexes separately. But, at first look, it would seem fertility appears to have returned to a dysgenic pattern.
Though before we go too far with that conclusion, let me show you something else:

This is average age of having the first child for the marked cohorts, for White Americans, from all GSS years. To ensure every respondent had a chance to contribute their likely lifetime datum, I included only individuals age 48 and older at the time of the survey. As we see, there is a fairly consistent pattern for smarter individuals to have their first child systematically later than dumber individuals. The pattern reverses a bit at the lowest IQ levels, it appears (note: this doesn’t appear to an artifact of small sample size).
Here are males and females separately:
For the 1970s (and younger) cohorts, the smartest individuals are likely not done having children, due to the high average age of first child, which is in the 30s for these folks. Indeed, see here [Edit, 10/21/14: I’ve inserted a chart that includes all sampled individuals from the 1970s cohorts, to increase the sample size. The samples are still pretty small (age 38 and older) –forewarned: samples are tiny, sometimes in the single digits]:

For the record, I did look at other races. Sample sizes are much smaller here, so charts would have much less value. For Blacks, fertility is generally much more strongly dysgenic throughout, increasing with time. The correlation between fertility and WORDSUM is remains in -0.19 to -0.25 range. However, the correlations are smaller in magnitude for the oldest cohorts, though it has to be expected that this is partly due to attrition through death at these ages. While samples are small, preliminarily for the 1970s cohort, the correlation is -0.30. The male-female difference was present, but small (see also Dysgenic Fertility Among Blacks? Apparently, Yes).
Samples sizes for Hispanics were too small to do anything useful.
Edit, 10/21/14: [On the advice of Greg Cochran, I also looked at whether the above pattern was just an artifact of unreliable WORDSUM scores by looking at fertility by education. Here at the results:

This is average number of children had by non-Hispanic Whites, age 44 or older, 95% confidence intervals shown. Here again we what looks like a neutral to perhaps very slightly negative relationship between education and fertility for the 1960s cohorts.
Here are males and females separately:

We see the classic pattern: fertility appears to be eugenic for men and dysgenic for women. Indeed, a look at the correlation between education and number of children shows very near neutral total fertility for the 1960s cohorts:
| Cohorts | Total fertility-Education correlation | Males only | Females only |
| 1930-1939 | -0.15 | -0.09 | -0.20 |
| 1940-1949 | -0.20 | -0.15 | -0.24 |
| 1950-1959 | -0.15 | -0.07 | -0.23 |
| 1960-1969 | -0.02 | +0.14 | -0.19 |
| 1970-1979 | -0.11 | – | – |
(Indeed, the correlation for the 1960s people becomes positive, r = 0.02, if I set the cutoff at age 48. This is driven by an increase in the correlation for men, from 0.14 to 0.20. This indicates that older fathers may be driving the relationship.)
Here are the 1970s cohorts (included only those age 40 or over) – sample sizes are very small, so I forwent the confidence intervals (0-1 = high school and below; 2 = some college; 3 = bachelors; 4 = graduate):

This suggests a return to a dysgenic pattern, as seen from the correlations. However, the as seen before, the small samples and the possible age effect makes this hard to call.
Either by the IQ (as gauged by the WORDSUM) or by reported education, the GSS data shows that dysgenic breeding seems to have significantly stalled or even reversed for those born in the 1960. For what it’s worth, Audacious Epigone has noted a decreasing correlation between the WORDSUM score and reported education in the GSS:
the correlation between wordsum scores and educational attainment by decade of birth among all native-born Americans who have participated in the GSS:
Born prior to 1950: .536
Born in the 1950s: .507
Born in the 1960s: .469
Born in the 1970s: .419
Born in the 1980s: .373
One serious issue would be this: the current neutral to slightly eugenic fertility reported in the GSS stems from a serious sex difference: eugenic for men and dysgenic for women. This leads one to suspect that low-IQ men may just be systematically underreporting the number of children they have, perhaps unwittingly so. To check for this, I looked at the total average number of children for men and women separately. I did find a slight difference (1.88 for men vs 1.96 for women), however it’s not statistically significant. ***End Edit***]
Looking at total fertility rates over time and age of first child underscores a pattern I found earlier (as noted in my post Some guys get all the babes – not exactly). Specifically, the Baby Boom was a brief period (at least during the past 100 years or so) where the total fraction of individuals who contributed to the gene pool increased:


In the era before the Baby Boom (the people who gave birth during the Great Depression), ~20% of individuals, male and female, had no children. That fraction fell to less than 10% during the Boom. It has since returned to its pre-Baby Boom size of ~20-25% (higher for males). During the Baby Boom, all sorts of individuals (about 10% more of the population) were having children who previously wouldn’t have. Since we see that in the pre-1900 cohorts, the fraction of the childless was about the same as it was for the people born at the start of the 20th century (~20%), this doesn’t appear to be solely a product of the generation trough during the Great Depression.
This may explain something noticed by blogger “Agnostic“: homeless individuals, who are very often mentally ill (especially schizophrenic) appear to be disproportionately Baby Boomers. If a certain segment of the population who, in earlier epochs, normally didn’t reproduce as much, suddenly increased their fertility due to a time of easy living, then you would expect an uptick of those sort of individuals in the following generation. If that 10% of people who bred more during the Boom were in the top 10% of those with genetic load, say, then the following era would witness a significant increase, at especially at the extreme ends of the distribution – which schizophrenia, for example, may represent.
These generational effects in fertility, with boom and bust cycles, represent the effects of the population cycle as described by Peter Turchin (see here for a good description of the process). Population growth sows the seeds of its undoing, by decreasing the share of resources (be it food, land, or these days, well-paying jobs) available to the up-and-coming generation. In short, the more people, the smaller slice of the pie each individual gets. The fewer people, the larger piece of the resource pie each family can acquire, typically boosting fertility. Immigration exacerbates these trends (see Turchin on it here). The whole process represents one of the most reliable “environmental” effects I have examined.
Coupled with the good times during the Baby Boom, we see that age of first child fell a bit (though it was fairly low before), as you’d expect. Afterwards, it rose significantly, especially for smarter women. The smartest individuals (WORDSUM 10 – roughly IQ 120+) now typically have their first child after their 30th birthday.
These and other factors makes many individuals (you know who you are) want to return us to the Baby Boom-like era, where labor was scare, and anyone who wanted a well-paying (though often gungy) job could have one. Restricting immigration, as Turchin discusses, is most likely to trend things in that direction. But it’s starting to look more and more questionable that the Baby Boom was an unadulterated good. Sure, the living was easy for those during the Boom, but its products haven’t necessarily been the best.
Fertility rose among everybody, even the smartest were breeding well over replacement then. However, the dumbest were breeding much more, more than they otherwise would, apparently. Perhaps excessive good times aren’t really all that great in the long run.
But, the following period appears to have given us an epoch of eugenic breeding, if ever slightly. Regardless, the important thing this demonstrates is that, at least in the U.S. anyway, we can forestall the coming of the supposedly inevitable idiocracy. We had a long way to go to get there anyway, but even that required a sustained dysgenic trend, and it’s unclear if that can be taken as a given. Razib Khan was right; population projections 50 years into the future are fantasy. Demographic trends have a nasty habit of changing quite a bit over time, enough to mess with the predictions of the most enlightened prophet.


Assortative mating.
Heck, when I was in my 20’s I dumped girlfriends who I considered not smart enough or intellectually ambitious enough until I found my wife. I totally based my marriage on eugenics, and it worked out very well for me.
Not sure how much other people are doing this, but Steve Sailer has written that assortative mating has increased in the past couple of decades.
The highly intelligent women I met were overly complicated, cold and/or emotionally unstable. After having dated a good number of them I stumbled across someone who was a bit smarter than average but also highly sociable (even friendly!), straight forward, and generally fun to be around. I found that to be a great deal more enjoyable and our marriage has lasted more than fifteen years. It’s also nice to have a regular person around. She keeps my feet if not completely grounded certainly somewhat closer than they might have been.
Marry someone who you love and make sure they love you and hope for the best. Nothing complicated about it.
Don’t forget “and then she frivolously divorces you when the youngest child is 3-5 YO for cash and prizes, permanently bankrupting you as she steals your children and permanently convinces them that you, and all your values, are evil and worthless.” Read Stephen Baskerville’s book “Taken Into Custody” if unclear on how this marriage thing mostly works in the U.S. now.
When I wrote about this–though with much less depth or detail–a couple years ago, Hail (of the blog Hail To You) pithily summarized the major questions raised:
This data suggests previous dysgenic-fertility was reversed among 1960s-born U.S. Whites (Judging by the IQ graph). They were of reproductive age in an era of easy-contraception, abortion, and the HIV Scare.
Abortion/Contraception: Eugenic?
Their final TFR was quite below replacement, though.
Mindweapon,
Re: assortative mating, don’t be so sure. The data shows pretty consistently over time that (among whites, anyway) the trend has been slightly eugenic among men and dysgenic among women. That doesn’t suggest assortative mating, it suggests that successful men marry women for the reasons men tend to marry women and that the lower classes are having fewer children today than they did 50 years ago (and so are the middle and upper classes but the shift has been gentler among the upper echelons).
I wouldn’t put much stock in Wordsum. I doubt that the dysgenic trend changed much during this period. Look at fertilty by education level, instead.
As for assortative mating for intelligence increasing during this period: Off the top of my head, I know of no evidence that this has actually happened.
I was going to say the exact same thing about using education instead of wordsum. While vocab has a g loading of 0.72 on the WAIS-IV, that’s with roughly 35 words, and a nuanced scoring system, A simple 10 word vocab test like wordsum could not be that g loaded and is probably completely useless above IQ 115.
Also, the negative correlation between IQ and fertility is only half the cause of the alleged 1 SD drop in genetic IQ. A more important factor is declining infant mortality:
@pumpkinperson:
There was absolutely no 1 SD drop in average IQ over the past century. A) It’s impossible, given the breeder’s equation B) its effect would be so plainly evident, yet we don’t see it. People need to retire that myth.
Yes, I agree, Wordsum is probably a highly noisy measure, and likely does have a ceiling effect, since the score is highly skewed right.
Jayman,
I’m not trying to take sides in that debate, but in my humble opinion it’s mathematically possible:
In my very humble opinion, the breeder’s equation only applies to rising IQ not falling IQ. Falling IQ is qualitatively different. Think of it this way. To revise a brilliant analogy by michael woodley, it could take days to ski up a hill, but only minutes to ski down it. So it could take tens of thousands of years for IQ to increase 15 points, but only a century for IQ to drop 15 points. That’s because IQ gains are constantly being pushes back by mutations, but those same mutations give falling IQ momentum so it’s like effortlessly skiing down a hill.
The reason dysgenics would not be evident if it occurred is that better nutrition has increased brain size & probably neuro-development perhaps by 1.6 SD over the 20th which would have greatly enhanced intelligence. Also, the huge rise in education & mass media exposure makes us seem way smarter than we are.
But yeah, I used to be a huge skeptic just like you. Only recently have I been willing to consider this idea seriously.
@pumpkinperson:
Not by much.
Look a 1 SD drop simply did not happen, for the reasons stated above. Don’t bring it up here again, thanks.
Not by much.
Look a 1 SD drop simply did not happen, for the reasons stated above. Don’t bring it up here again, thanks.
I promise I’ll never mention it here again. I’m a huge fan of your blog & don’t wish to get banned.
Cheers!
This cannot last forever. Computer technology increases the relationship between intelligence and income. As time goes on it is taking more and more intelligence to earn enough money to raise a family.
I just rediscovered Jayman’s blog from Nicholas Wade’s new book, Troublesome Inheritance. I am not a racist, but I like what Nicholas Wade wrote. Racial differences are real, but I object to racism or discrimination. In fact, I approve of affirmative action as long as there’s no quotas. Hatred or prejudice based on race or religion should be discouraged. Discussing fertility and eugenics is great. Keep up the good work, Jayman. I used to have a black friend who was not afraid of talking about race. He was mixed-ancestry like you.
Good post! How are these conclusions affected when you factor in immigration and the fertility of NAM’s.
Could the slight eugenic bump be explained by Murray and Herrnstein’s argument in The Bell Curve? If I remember correctly, they said the sorting process by IQ really got going post-WWII…
An idiocacy won’t happen not because of assortive mating, but because within any population you’re going to have, by pure chance, some smart people. That’s the beauty of the bell curve. If two dumb parents have 30 kids, one will have an IQ above 125 or so, unlike in the movie.
Exactly. That’s part of the reason why population IQ is almost unrelated to population levels of innovation.
More to the point, dysgenics, even though it is probably real, is entirely outweighed by the Flynn effect. There is no conceivable sense in which people’s intelligence has decreased over the last hundred years. Not a single one.
Innovation rates, which Michael Woodley and Bruce Charlton are fond of citing as evidence that dysgenics has real-world effects, are worthless indicators of population IQ. The r between country science Nobels per capital and country IQ is about 0.3. Also, great innovators don’t need to and often don’t have high IQs. Feynman’s was 125, Alvarez and Shockley were both around 130.
@Albert Richman:
I seriously doubt Feynman’s IQ was only 125.
I don’t. Feynman was terrible at just about anything outside of physics and math –- read his autobiographical essays. He had massively lopsided cognitive abilities, like a high-IQ idiot savant.
That said, adjusted for the “real” portion of the Flynn effect Feynman’s IQ would have been around 110, which does seem a tad low. So probably the Stanford-Binet underestimated his intelligence a bit. I think 125 is about right.
@Albert Richman:
Possibly. Don’t buy 125 for a second. 🙂
@JayMan
I was skeptical as well, and a quick google search showed me this:
http://en.wikipedia.org/wiki/Richard_Feynman#Education
Steve Hsu’s comment on Feynman’s IQ:
“3. Is it true Feynman’s IQ score was only 125?
Feynman was universally regarded as one of the fastest thinking and most creative theorists in his generation. Yet it has been reported-including by Feynman himself-that he only obtained a score of 125 on a school IQ test. I suspect that this test emphasized verbal, as opposed to mathematical, ability. Feynman received the highest score in the country by a large margin on the notoriously difficult Putnam mathematics competition exam, although he joined the MIT team on short notice and did not prepare for the test. He also reportedly had the highest scores on record on the math/physics graduate admission exams at Princeton. It seems quite possible to me that Feynman’s cognitive abilities might have been a bit lopsided-his vocabulary and verbal ability were well above average, but perhaps not as great as his mathematical abilities. I recall looking at excerpts from a notebook Feynman kept while an undergraduate. While the notes covered very advanced topics for an undergraduate-including general relativity and the Dirac equation-it also contained a number of misspellings and grammatical errors. I doubt Feynman cared very much about such things.”
http://www.psychologytoday.com/blog/finding-the-next-einstein/201112/polymath-physicist-richard-feynmans-low-iq-and-finding-another
@Julian:
Lopsided abilities? Sure. 125 verbal IQ? Doubt it. More likely this was the result of a bad test score.
I don’t know how great I.Q. is as a be-all, end-all. My I.Q. Is 147 ( yes I am a “genius”) but I have so many personal and mental problem I am often barely functional. I also suffer from a rate genetic disease, but I think a good chunk of my problems are psychological, which is tied to my ability to deeply perceive the experiences of others. For example, after the plane went down over the Ukraine, I found myself compelled to imagine myself experiencing every little emotional and sensory aspect of being on that plane. I was compelled to do this for hours. This happens often.
Yes I have a high I.Q. , and though I have no evidence, I wonder if my mania and dysfunctionally high I. Q. are linked.
Lol clearly high I.Q. Hasn’t prevented my spelling errors.
The people with 115- 130 I.Q.s are the best off. None of the dysfunctionality.
I’d lose fifteen points if that meant I would be charismatic and/or athletic.
@Randal Flagg,
The connection between IQ and mental illness is unclear. Since low IQ and mental illness are both largely caused by genetic load, you’d expect the association to be negative. Some very high IQs may be driven by mutations of large effect, so that might be giving that subset a higher burden of illness.
I have an hypotesis that some of the extreme effects on dropping fertility rates in what used to be called first-world or western countries is because there seems to be a “time gap” in almost all of these countries between when workplace gender equality sets in and until a more “gender equal” division of labour in the domestic sphere occurs.
If societal norms as well as personal values are such that women still are expected to perform a large majority of the unpaid domestic work even if both spouses work full time and even have comparable income it is not real easy to blame women in general and espesially smart, educated women if they chose to have few or even no kids.
That’s not to say that domestic involvement must be exactly 50-50 even in total and certanly not as a matter of each individual activity. But just from anecdotal observations in the various countries I’ve personally been exposed to, women no longer see men who contribute a paycheck and not that much else as “father material”.
In any case, as you and others have already shown in diffrent posts. If not provided an “acceptable” compromise to be working mothers. Many women (and disproportionaly smart women at that) will simply not become mothers at all.
@X:
I’ve heard this before. Worth taking a look at. Maybe. Remind me again for my upcoming posts, please.
I suspect you have something there. Advanced IQ may be dysgenic in homo sapiens females. Current female oxytocin levels may not be enough to compensate for the availability of The Pill.
That would depend on what you consider housework. Women have defined housework as THEIR household chores. Apparently decorating, moving furniture and other heavy objects, and tending to the garden is not housework. Also a lot of men like to cook, and when I say cook I mean making meals from scratch. Not throwing artificial slave food loaded with sugar and salt into the microwave. Listening to women complain about housework, you would think they were living in the late 19th, washing clothes with their hands, and scrubbing the floor like Cinderella.
High intelligence is in reference to “novel” processing in one’s environment. Average people may still be more “intelligent” when it comes to evolutionarily familiar tasks like mating and socialization, yet be bad with computers due to man not evolving to cope with them for thousands of years (this is where high IQ comes in handy).
Sustaining a brain that can manage novel tasks remarkably well is the likely result of an tradeoff. One can not devote serious metabolic energy towards muscles AND brains, or probably even “novel-processing” brains and “socializing” type brains. Half-sigma/Lion of the blogosphere found that as Wordsum increases, self-reported athleticism decreases (I know, C doesn’t equal C, but it’s worth pondering.)
@jjbees:
This is Kanazawa’s Savanna hypothesis. I’m having serious doubts in it as of late. None of the evidence he claims supports it comes from non-Western samples. A priori I can think of no reason why intelligent people would be less well off on “evolutionarily familiar” tasks.
Could this have somethng to do with it?
http://www.angelfire.com/rnb/y/ratesusa.htm#years
I beleive incarceration rates are much higher among those with low IQ. Despite some high-profile cases with mass murderers and the like, I have to think being in the can puts a crimp in your rate of procreation. Are we seeing unintendedconsequences of the war on drugs?
Even assuming that current breeding patterns are mildly eugenic, Michael Woodley’s point is that it will not be sufficient to negate the growing mutation load in a population where virtually everyone survives to breeding age. In the US at least, looking at SAT scores and scientific innovation, it seems to me that attempts to brush this issue off are not going to succeed. What is your position, Jayman?
@pyrrhus99:
In short, I think Woodley is off kilter on this one.
First of course eugenic breeding = decreasing genetic load.
Second, increasing genetic load would take many generations to make much of a noticeable difference on anything.
So no, not worried about the things Woodley expects us to worry about.
I think that mutation load has increased, to a noticeable extent, over the past 150 years. Considering the high human mutation rate, the infant mortality rate that was characteristic to the past (about 60% in hunter gatherers, and probably not much lower up until the 19th century), and the increase in paternal age, I would guess mutation load has increased by not under half a standard deviation in the intervening time.
But this does not translate into a decline in intelligence. Mutation load does not actually have a huge effect on intelligence: consider the poor (-0.2 or less) correlations between mortality and IQ, physical abnormalities and IQ, paternal age and IQ, etc. I would bet it has a huge effect on mental illness, especially psychosis –– but not on IQ.
@pyrrhus: The SAT scores are worthless because of changing representativity. The NAEP tests given to 9 year olds in 1970 and today show about a 1 SD increase (keep in mind that there are no changing representativity issues here, since virtually every 9 year old then and now was in school –- and indeed, older children show a much smaller Flynn effect on the NAEP). Reading comprehension tests given to Chicagoan adults in 1937 were ludicrously, laughably simple. Contrary to popular belief, school achievement shows a quite large Flynn effect, although not so large as the fluid intelligence Flynn effect.
There is simply no decent index of intelligence, with the pretty crappy exceptions of simple reaction time and innovation per capita, that has shown a decline over time. ABSOLUTELY NONE, and I’ve spent a year searching. And it pisses me off when people try to gerrymander exceptions.
Frankly, I think a lot of the nonsense related to dysgenics is analogous to white ethnomasochism. Certain people have a psychological need, who knows why, to believe that past generations were their intellectual superiors, in the same way that certain whites have a psychological need to believe that other races are their moral superiors.
@Albert Richman:
At some point, one of us has to crunch the numbers. <a href="https://www.researchgate.net/profile/Anthony_Volk/publication/256641936_Infant_and_child_death_in_the_human_environment_of_evolutionary_adaptation/links/0046352385d075ed6b000000.pdf (Volk & Atkinson, 2013), by the way.
Well, there’s the work of Lars Penke. So there may be something to that…
Pretty much…
Albert Richman,
There have been rare studies where short forms of the SAT were given to representative samples. See page 422 of the book “The Bell Curve”. And the SAT Flynn Effect is very tiny. Equivalent to only 0.5 IQ points a decade.
If fertility is eugenic for men and dysgenic for women, why do we see very few Harvard/MIT men married to low IQ Shaniquas? Or, if it is because the Shaniquas are mostly Black/Hispanic, why don’t the Harvard men marry low IQ June Shannon types? I have met enough of the intelligentsia to know that most of the IQ 130+ set marry each other. In fact, a “mixed marriage” in those circles refers to a Harvard-Yale pairing, or a Columbia-Princeton pairing.
I think that fertility for men at the low levels of IQ is unreliable. The high IQ well behaved White and Asian men generally wait till marriage to have children. The low IQ men in the trailer parks often underestimate how many children they have.
@Anonymous:
“The low IQ men in the trailer parks often underestimate how many children they have.”
Quite possibly. A key limitation of relying on self-reported data.
Reblogged this on Philosophies of a Disenchanted Scholar and commented:
Hopeful, I do hope this is correct and the effect can be staved off.
Hey I’m late to the party but I came to say there’s a serious flaw in your result for the 1960-1969 cohort. You can’t draw from all GSS years because number of childs and wordsum scores are both strongly correlated with age. You can only draw from GSS years after the number of children for the individual respondents has stabilized. In other words, you can only draw from years when the age of the respondents is no less than 45. Since GSS years start in 1972, this makes no difference for the 1883-1927 cohorts, but it becomes a bigger problem for every cohort after that.
I redid your analysis with this restriction and got the following result. It’s negative all the way down:
Cohorts | total correlation | M | F
1883-1909 | -0.14 | -0.16 | -0.13
1910-1919 | -0.07 | -0.03 | -0.10
1920-1929 | -0.11 | -0.11 | -0.11
1930-1939 | -0.12 | -0.09 | -0.15
1940-1949 | -0.13 | -0.08 | -0.16
1950-1959 | -0.11 | -0.05 | -0.16
1960-1969 | -0.10 | -0.09 | -0.11
1970-1979 | NO DATA
Okay I read Jayman’s method more closely and I see that he did filter for respondents who were at least 42 years old at the time of responding. This is similar to what I wanted to do by drawing only from years where the youngest of the cohort is old enough to have a stabilized CHILDS score. Except that Jayman’s way oversamples from the oldest of the cohort because 1969 babies only had the GSS year of 2011 when they were old enough to pass this age filter, whereas 1960 babies had GSS years of 2002-2011 when they were old enough to pass the survey. So the oversampling makes it not perfect but it’s hardly a “serious” flaw.
I redid the analysis again using Jayman’s age filtering and only GSS years up to 2011 (which I think is what was available when the original blog post was written in 2014). I also filtered for RACE(1) like Jayman did. Here is the result.
Cohorts | total correlation | M | F
1960-1969 | +0.01 | +0.08 | -0.08
So I did nearly replicate Jayman’s result using his exact method which wasn’t “seriously” flawed, but now with GSS years available up to 2016 and using a different filter to draw years as in my first comment, the result is not replicated.