
Rebutting Chanda Chisala
(This is also published at The Unz Review.)
Chanda Chisala has been producing pile after pile of nonsense for quite some time. At first, I was content with simply leaving comments at his posts refuting his rubbish because it was rather easy to point out where he was full of baloney. Since then, I’ve been banned by him, mostly for my signature flair. 🙂
I intended to continue to ignore his nonsense since it was such obvious rubbish that it didn’t seem to be worth my (now very precious) time. But then I realized the value of having nonsense essays picked apart for the nonsense they are. Rebuttals are highly valuable to skeptical readers who doubt nonsense but can’t quite put their finger on the problems themselves. So, in that service, I write this rebuttal to Chisala’s latest piece.
Chisala’s theory is that different human groups differ in the degree of genetic canalization, and that explains the differences in average IQ between groups. It seems he lifted the concept of genetic canalization from Greg Cochran, who I’ll let describe the phenomenon. From Survival of the Flattest | West Hunter :
Genetic canalization is the extent to which an organism is buffered against the effects of mutations. Waddington said “developmental reactions, as they occur in organisms submitted to natural selection…are adjusted so as to bring about one definite end-result regardless of minor variations in conditions during the course of the reaction”. Canalization can act to buffer against environmental perturbations, and selection for resistance to such environmental noise may also produce resistance to genetic noise. But right now I’m thinking about genetic canalization.
Up to some point, the effects of not too many, not too serious mutations would be buffered: those mutations wouldn’t change the phenotype. In the same way, your typical tractor is not designed to nanometer tolerances: parts can be somewhat out of spec – up to some limit – without messing up performance.
…
Canalization is a product of natural selection. There would be stronger selection for efficient canalization in a species with more genetic load
…
It might explain why load doesn’t seem to have much effect on IQ over most of the range, why we haven’t seen general IQ depression in the children of old men.
So Chisala’s idea is that certain racial groups have greater levels of canalization, and that makes them more resistant to environmental stresses that might lower average IQ.
Oh God! Where to begin….
It’s hard for me tell if Chisala really believes what he’s saying. Because the truth of the matter is that he’s a bullshit artist, either wittingly or unwittingly. It appears that he has only a superficial understanding of the matters he discusses, and he tries to weave together cherry-picked pieces of information into a seemingly convincing story – at least for those who don’t know any better.
First of all, Chisala is claiming that there are no “genetic” group differences in IQ. Rather, every group has the same average IQ potential, but each group has a different level of canalization, thanks to natural selection (and this is not even genetic canalization – as in resistance to mutations – as Cochran discussed, but resistance to purported environmental insults). This makes each more or less resistant to the purportedly IQ-depressing effects of deprived environment. So first it’s not genetic, but it is? Which is it, man?
 I don’t even want to imagine what reaction this particular proposition would garner if you ran it by this guy. —>
Second, Chisala seems to have no understanding of the concepts of elite samples, founder effects, measurement error, sampling bias, or of basic statistical principles like statistics of small numbers. That’s not even to mention his apparent lack of understanding of the breeder’s equation (but at least there he has plenty of company). He seems to be mystified by apparent incongruities he encounters in his cherry-picked (and often outdated) samples because of his ignorance of these important concepts and many other facts.
I’m not going to debunk Chisala’s claims point-by-point, because, really that’s not necessary (and his piece is much to confused to make that a worthwhile endeavor). Instead, I’m going to point out some key facts make his claims ridiculous.
One of those key facts is this:
There are global differences in brain size. Brain size is certainly related to intelligence, both on the individual level (Pietschnig et al 2015) and (even more so) on the group level (though the both the group level and individual level correlations are less than 1.0). In order for Chisala’s idea to work, these environmental insults must also cause certain racial group differences in brain size.
 But, as we know, it’s not outside the realm of possibility that environmental insults can affect brain size (see the Zika virus). And sure, sub-Saharan Africa is loaded with pathogens and other environmental insults. But racial differences in brain size are seen between people of European, African, and Asian ancestry in the United States (from Rushton & Jensen, 2010):

(At this point, of course, we cue the sociologist’s fallacy invoking the poorer environments of Blacks even in the U.S.) But, Chisala is claiming Blacks are more susceptable to environmental insults that supposedly affect IQ – insults that (save perhaps iodine deficiency) have not been shown to actually impact IQ in any way. I’ll go into more detail in a future post, but there is little solid evidence for a negative impact of most supposed environmental insults on IQ.
For now, I’ll give you Greg Cochran on this (from The Great IQ Depression | West Hunter):
We hear that poverty can sap brainpower, reduce frontal lobe function, induce the fantods, etc. But exactly what do we mean by ‘poverty’? If we’re talking about an absolute, rather than relative, standard of living, most of the world today must be in poverty, as well as almost everyone who lived much before the present. Most Chinese are poorer than the official US poverty level, right? The US had fairly rapid economic growth until the last generation or so, so if you go very far back in time, almost everyone was poor, by modern standards. Even those who were considered rich at the time suffered from zero prenatal care, largely useless medicine, tabletless high schools, and slow Internet connections. They had to ride horses that had lousy acceleration and pooped all over the place.
In particular, if all this poverty-gives-you-emerods stuff is true, scholastic achievement should have collapsed in the Great Depression – and with the miracle of epigenetics, most of us should still be suffering those bad effects.
But somehow none of this seems to have gone through the formality of actually happening.
Of course, it’s also worth mentioning that brain structure differs detectably by race, as previously discussed:
a new paper, Fan et al 2015, that the details of cortical surface structure of the brain is highly predictive of genetic ancestry. Indeed, as Fan et al put it:
Here, we demonstrate that the three-dimensional geometry of cortical surface is highly predictive of individuals’ genetic ancestry in West Africa, Europe, East Asia, and America, even though their genetic background has been shaped by multiple waves of migratory and admixture events. The geometry of the cortical surface contains richer information about ancestry than the areal variability of the cortical surface, independent of total brain volumes. Besides explaining more ancestry variance than other brain imaging measurements, the 3D geometry of the cortical surface further characterizes distinct regional patterns in the folding and gyrification.
Indeed, an earlier paper from this team (Bakken, Dale, and Schork, 2011) found that this workswithin racial groups as well, as the case with Europeans (see also the section Intraracial Group Variation below):
In our group’s previous study, we found that area measures of cortical surface and totalbrain volumes of individuals of European descent in the United States correlate significantly with their ancestral geographic locations in Europe

Then there is the work David Piffer on polygenetic score. Basically, the known genomic hits to IQ vary in frequency between the different populations highly according to average IQ. From Piffer 2015:
Published Genome Wide Association Studies (GWAS), reporting the presence of alleles exhibiting significant and replicable associations with IQ, are reviewed. The average between-population frequency (polygenic score) of nine alleles positively and significantly associated with intelligence is strongly correlated to country-level IQ (r = .91). Factor analysis of allele frequencies furthermore identified a metagene with a similar correlation to country IQ (r = .86). The majority of the alleles (seven out of nine) loaded positively on this metagene. Allele frequencies varied by continent in a way that corresponds with observed population differences in average phenotypic intelligence.
Here is a scatter plot from the paper:

Going even beyond this, if we follow Chisala’s logic and assume that somehow adverse reactions to the environment are responsible for the size, structural, and performance differences of African brains relative to other groups, then we have another problem: the performance difference between different human groups isn’t a 20th and 21st century phenomenon only – it goes back for the entirety of recorded history.
As we’ve seen before, and as Bryan Caplan recounts, the differences between human groups in development goes back thousands of years – such that level of development as far back as 1000 B.C. is predictive of development today. Indeed, as Easterly, Coming, and Gong (2007) recount:
We assemble a dataset on technology adoption in 1000 B.C., 0 A.D., and 1500 A.D. for the predecessors of today’s nation states. We find that this very old history of technology adoption is surprisingly significant for today’s national development outcomes. Although our strongest results are for 1500 A.D., we find that even technology as old as 1000 B.C. is associated with today’s outcomes in some plausible specifications.
It’s not like the poor performers and the strong performers of today are a new thing. They’ve been poor performers and strong performers throughout history (by and large). Indeed, in sub-Saharan Africa (emphasis mine):
Why this meandering reminiscence of mine about a random ruin in Turkey? Because sub-Saharan Africa has remarkably few ruins for its immense size.
This fact is not well known. It is so hazy in the contemporary mind that Henry Louis Gates managed to sell PBS on a six episode miniseries about African ruins called The Wonders of Africa without, apparently, anybody in PBS management calling his bluff about the lack of wonders that his camera crew would wind up documenting in one of the most boring documentary series of the 21st Century.
By contrast, as we know, there was plenty of development in East Asia and Europe, especially Northwestern Europe:


As Staffan put it, “we can’t adjust for their entire history.”
In any case, this recent nonsense idea of Chisala, aside from running afoul Occam’s Razor, is his attempt to undercut the rebuttal to the deprivation argument. That is, it is a common argument of blank slatists that poverty and other forms of deprivation are responsible for differences in average IQ and national performance. Aside from emptiness of the whole deprivation argument, as noted above, there is the fact (as pointed out by me in Welcome Readers from Portugal!) that outliers to this pattern of deprivation and IQ all perform in accordance to their measured IQ, not according to their level of deprivation. Poor rural Chinese perform nearly as well in IQ and scholastically as the other East Asian societies do. Citizens in wealthy Arab oil states perform as badly as those in poorer ones which lack oil. I’m sure Chisala doesn’t like this particular uncomfortable fact, so I suspect he concocted his feeble theory in part to try to nullify this unwelcome reality.
And finally, there is the fundamental problem that Chisala doesn’t understand either evolution or the formula that guides it, the breeder’s equation. There is no reason to suspect that human groups that have been separated for tens of thousands of years in vastly different environments would be the same in all their cognitive and behavioral qualities. In fact, a priori we should expect them not to be, since such equivalence after so many generations of separate evolution is nigh impossible.
I expected most of this to be obvious, which is why I haven’t paid too much attention to Chisala’s posts. But, I may have overestimated both his impact and people’s ability to spot the obvious, hence, this writing.
Commenters, please be aware of my comment policy.


Quick question.
Have you seen some of the work on lead as a possible explanation for a large portion of the American black white iq gap (5-10 points)?While not incompatible with a genetic component, it does suggest that the genetic gap isn’t as wide as previously thought. I’m on my phone so I don’t have access to the papers, but if I get a chance I’ll drop a link .
Also much of Africa is notoriously polluted by local metal mines and refineries, which helps explain the 20 odd point gap between sub Saharan Africa and the US.
Just curious about your knowledge and opinions.
Transracial adoption studies find that individuals from other races perform according to their race when adopted by Whites, so no, I don’t think there is anything to the lead idea.
From https://en.wikipedia.org/wiki/Race_and_intelligence#Adoption_studies
” Scarr and Weinberg the authors of the original study, did not themselves consider that it provided support for either the hereditarian or environmentalist view.[129]
Three other adoption studies found contrary evidence to the Minnesota study, lending support to a mostly environmental hypothesis:
Eyferth (1961) studied the out-of-wedlock children of black and white soldiers stationed in Germany after World War 2 and then raised by white German mothers and found no significant differences.
Tizard et al. (1972) studied black (African and West Indian), white, and mixed-race children raised in British long-stay residential nurseries. Three out of four tests found no significant differences. One test found higher scores for non-whites.
Moore (1986) compared black and mixed-race children adopted by either black or white middle-class families in the United States. Moore observed that 23 black and interracial children raised by white parents had a significantly higher mean score than 23 age-matched children raised by black parents (117 vs 104), and argued that differences in early socialization explained these differences.
Rushton and Jensen have argued that unlike the Minnesota Transracial Adoption Study, these studies did not retest the children post-adolescence when heritability of IQ would presumably be higher.[22][46] Nisbett (2009, p. 226) however point out that the difference in heritability between ages 7 and 17 are quite small, and that consequently this is no reason to disregard Moore’s findings.
Frydman and Lynn (1989) showed a mean IQ of 119 for Korean infants adopted by Belgian families. After correcting for the Flynn effect, the IQ of the adopted Korean children was still 10 points higher than the indigenous Belgian children.[130][19][131]
Reviewing the evidence from adoption studies Mackintosh considers the studies by Tizard and Eyferth to be inconclusive, and the Minnesota study to be consistent only with a partial genetic hypothesis. On the whole he finds that environmental and genetic variables remain confounded and considers evidence from adoption studies inconclusive on the whole, and fully compatible with a 100% environmental explanation. ”
What do you think about that?
Hmm, yeah Occam is a bitch. Makes sense though, although… In utero exposure maybe? Eh I’m getting into motivated reasoning here.
I’ve been musing on policy implications of HBD for a while now, and I’ve come to the conclusion that with increased understanding of the genome, genomic editing, and embryo selection a lot of net negative social consequences of HBD could probably ameliorated in the near future through essentially soft (non coercive) eugenics. Thoughts?
While public opposition to HBD on principle might seem like a serious impediment to implementing such a program, I suspect individual incentives could be reasonably expected to overcome social stigma. Who cares if the program is racist my kid is gonna have a 130 iq and get rich! Sort of thing. Mind you the consequences of a society of 130 iq average (by today’s standards, yes I know iq is renormed intermittently) are themselves concerning.
Don’t expect embryo selection/Gene editing to have a huge impact on the overall picture any time soon. Eventually, probably, but it won’t be overnight.
Off topic (but not much): this is an Alt Right aggregator I set up just the other day to aggregate the latest updates from over 100 Alt Right sites and blogs. Check it, bookmark it, spread the word. Jay Man’s blog by the way is there too, obviously: http://theshitlordhub.blogspot.co.uk/
You had me until you showed those “Concentrations within European Core” and “Origins of Significant Figures” images.
Quick reverse search shows me they’re from the authorship of a Brit as well, and from an English-point of view.
I’m sure you’re a reasonable person, since in fact in your post you manage to nullify any kind of argument ad environmental cause one can make, so I think we can both agree upon the absurd amount of subjectivity and political and ethnocentric bias that occurs in those maps. I can think of at least 5 people, at the top of my head from my city of Porto, by the northern coast of this tiny rectangle you know as Portugal, who have all been described, abroad, as being the very best among their peers, majority of them NW European, yet those maps show no such thing.
I find it quite irritating that you’re relying on them to justify your premises.
Anyway, a good post nonetheless
Also, on a side note, and since you mentioned your “Welcome Readers from Portugal”, I think you’re underestimating the effect of a couple of things in your post about Portugal, you’re also right about many things, however the reason why some of us may find it hard to see the truth is because it doesn’t add up to our observations of reality, and the reason for this being that we are posting from the main cities in the Northern and Central coasts, and don’t have contact with the almost medieval hinterland, where people still think it’s the Sun that revolves around the Earth. Anyway, here are my points:
1)The aforementioned difference between the intelligence within the country. The irony is that we like to joke about differences in phenotype, and don’t realize the much greater difference in IQ that we will find. I wish I could upload a simple sketch, but you pretty much go from a Northern-Central Coastal region + Lisbon, so around 40% of the total population, that fares along the average of Germany (or maybe even a tad better), to the rest of the country, 60% of the population, that fares more along the lines of Brasil.
I know this may sound hard to believe, but it’s the truth, and the reason why so many of my countrymen, living in the developed areas, struggle to cope with the reality.
2)Pre-1970s IQ tests are hardly valid anymore, since around a million people left the country, a huge percentage of the population, and those were mostly the rural folk of the hinterland of the country. Just to exemplify the magnitude of difference in intelligence we are talking about, the province of my city, and the provinces to the North and South fared better in the 2009 than the German average, yet the province in the hinterland, just 80km to the east, probably fared more along the lines of the Brasilian average.
3)We had a central authority actively rejecting and impeding the progress of literacy. If former Communist countries get a break due to their socialist legacy and centralized planning of mass poverty, you should consider giving us one too due to our centralized planning of mass illiteracy.
If you doubt me on any of these points I can provide a source for my claims.
It’s from Charles Murray’s Human Accomplishmemt. He has recently made all his data public. Go check it out for yourself.
Over all, there is no question of the outsized contributions of Northwestern Europe to human accomplishment, see the linked post.
I can see that as plausible, actually. There is precious little regional data from Portugal, unfortunately.
I don’t give the ex-communist countries any such break.
“Over all, there is no question of the outsized contributions of Northwestern Europe to human accomplishment, see the linked post.”
I don’t even think that is up for debate. What I do believe, is that precisely quantifying by how much, is going to be subjective and deeply biased and of course political.It logically follows from the somewhat subjective nature of the question itself.
And that’s a huge database which I’m not going to methodically search for this more casual discussion thread, maybe in another occasion.
“I can see that as plausible, actually. There is precious little regional data from Portugal, unfortunately.”
https://www.bportugal.pt/pt-PT/BdP%20Publicaes%20de%20Investigao/ab201215_p.pdf – It’s the only document I know of that can be used to provide a regional estimate of IQ in Portugal, there is essentially no more data available to the extend of my knowledge
To summarize it, page 4 (62 in the doc.) provides a breakdown of the areas, and page 5 (63 in the doc.) the -2009- PISA scores by region, under the x-axis, titled “PISA, pontuações médias”, with the y-axis being the scores on our national exams.
An example – Greater Lisbon’s score in was: 504 Math section, 510 Reading section.
Another example – The Algarve’s score in was: 457(!) Math section, 462 Reading section.
Page 6 (64 in the doc.), Gráfico3 shows the percentage of students at level 1 and lower in red, and at level 5 or above in blue, in both Mathematics and Reading, by region
The rest of the document is useless baloney as the researchers attempt to “correct” the scores for socioeconomic factors and conclude they add up.
Of course they do, they just got the arrow of causation pointed in the wrong direction.
Final notes:
-These are very reliable scores as far as I know, PISA gave the all-clear and detected no irregularities. Personally, I believe them to be very accurate.
-A huge percentage of the population lives in the areas called “Porto”, “Centro Litoral” and “Lisbon” as any population density map for the country will show.
-The region for the Greater Porto should extend farther to the North and to the East (to the hinterland) than what is represented in page 4 (62 in the doc.)
-Do not use our national exams to estimate IQ by region, since they’re absolutely worthless to provide it due to the myriad of problems surrounding them and attempts to “correct” the score to make some regions looks not as bad, essentially sweeping the truth under a rug, and would definitely stick with the PISA scores.
-I hope you find the data useful, it’s from a report that PISA gave our government. I also hope you understand why some of my countrymen look in disbelief at your blog, because they are simply not aware of the difference between their major conurbation and the country’s hinterland.
I’m wondering now, did you get my post with the regional data for Portugal? I think you will find it interesting, especially if you compare it to a topographic map of the country and a population density map too. It lends credence to some of your ideas and might lead to a slight adjustment to the Hajnal line for Iberia, while further supporting it’s existence here.
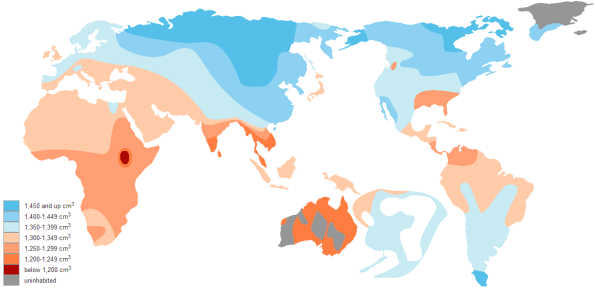
The map of brain size fascinates me, even though I know it’s not exactly an IQ map. I’m assuming it refers to the brain size of the indigenous populations, even in areas like the U.S. where those populations have been more or less replaced. Anyway, any thoughts on the outliers? I’m guessing the UK and Japan missed out based on their genetic isolation, and maybe the Nile River Valley experienced positive selection of some sort perhaps as a result of their long history of civilization. But what’s with that black hole over South Sudan?
Yes these are indigenous populations.
Some of the really small brain sizes from Africa are Pygmy groups.
*bologna not baloney